Site Planner & Network Expansion
Evaluate new screen installation sites using AI-powered footfall traffic analytics, revenue forecasting, and venue benchmarking.
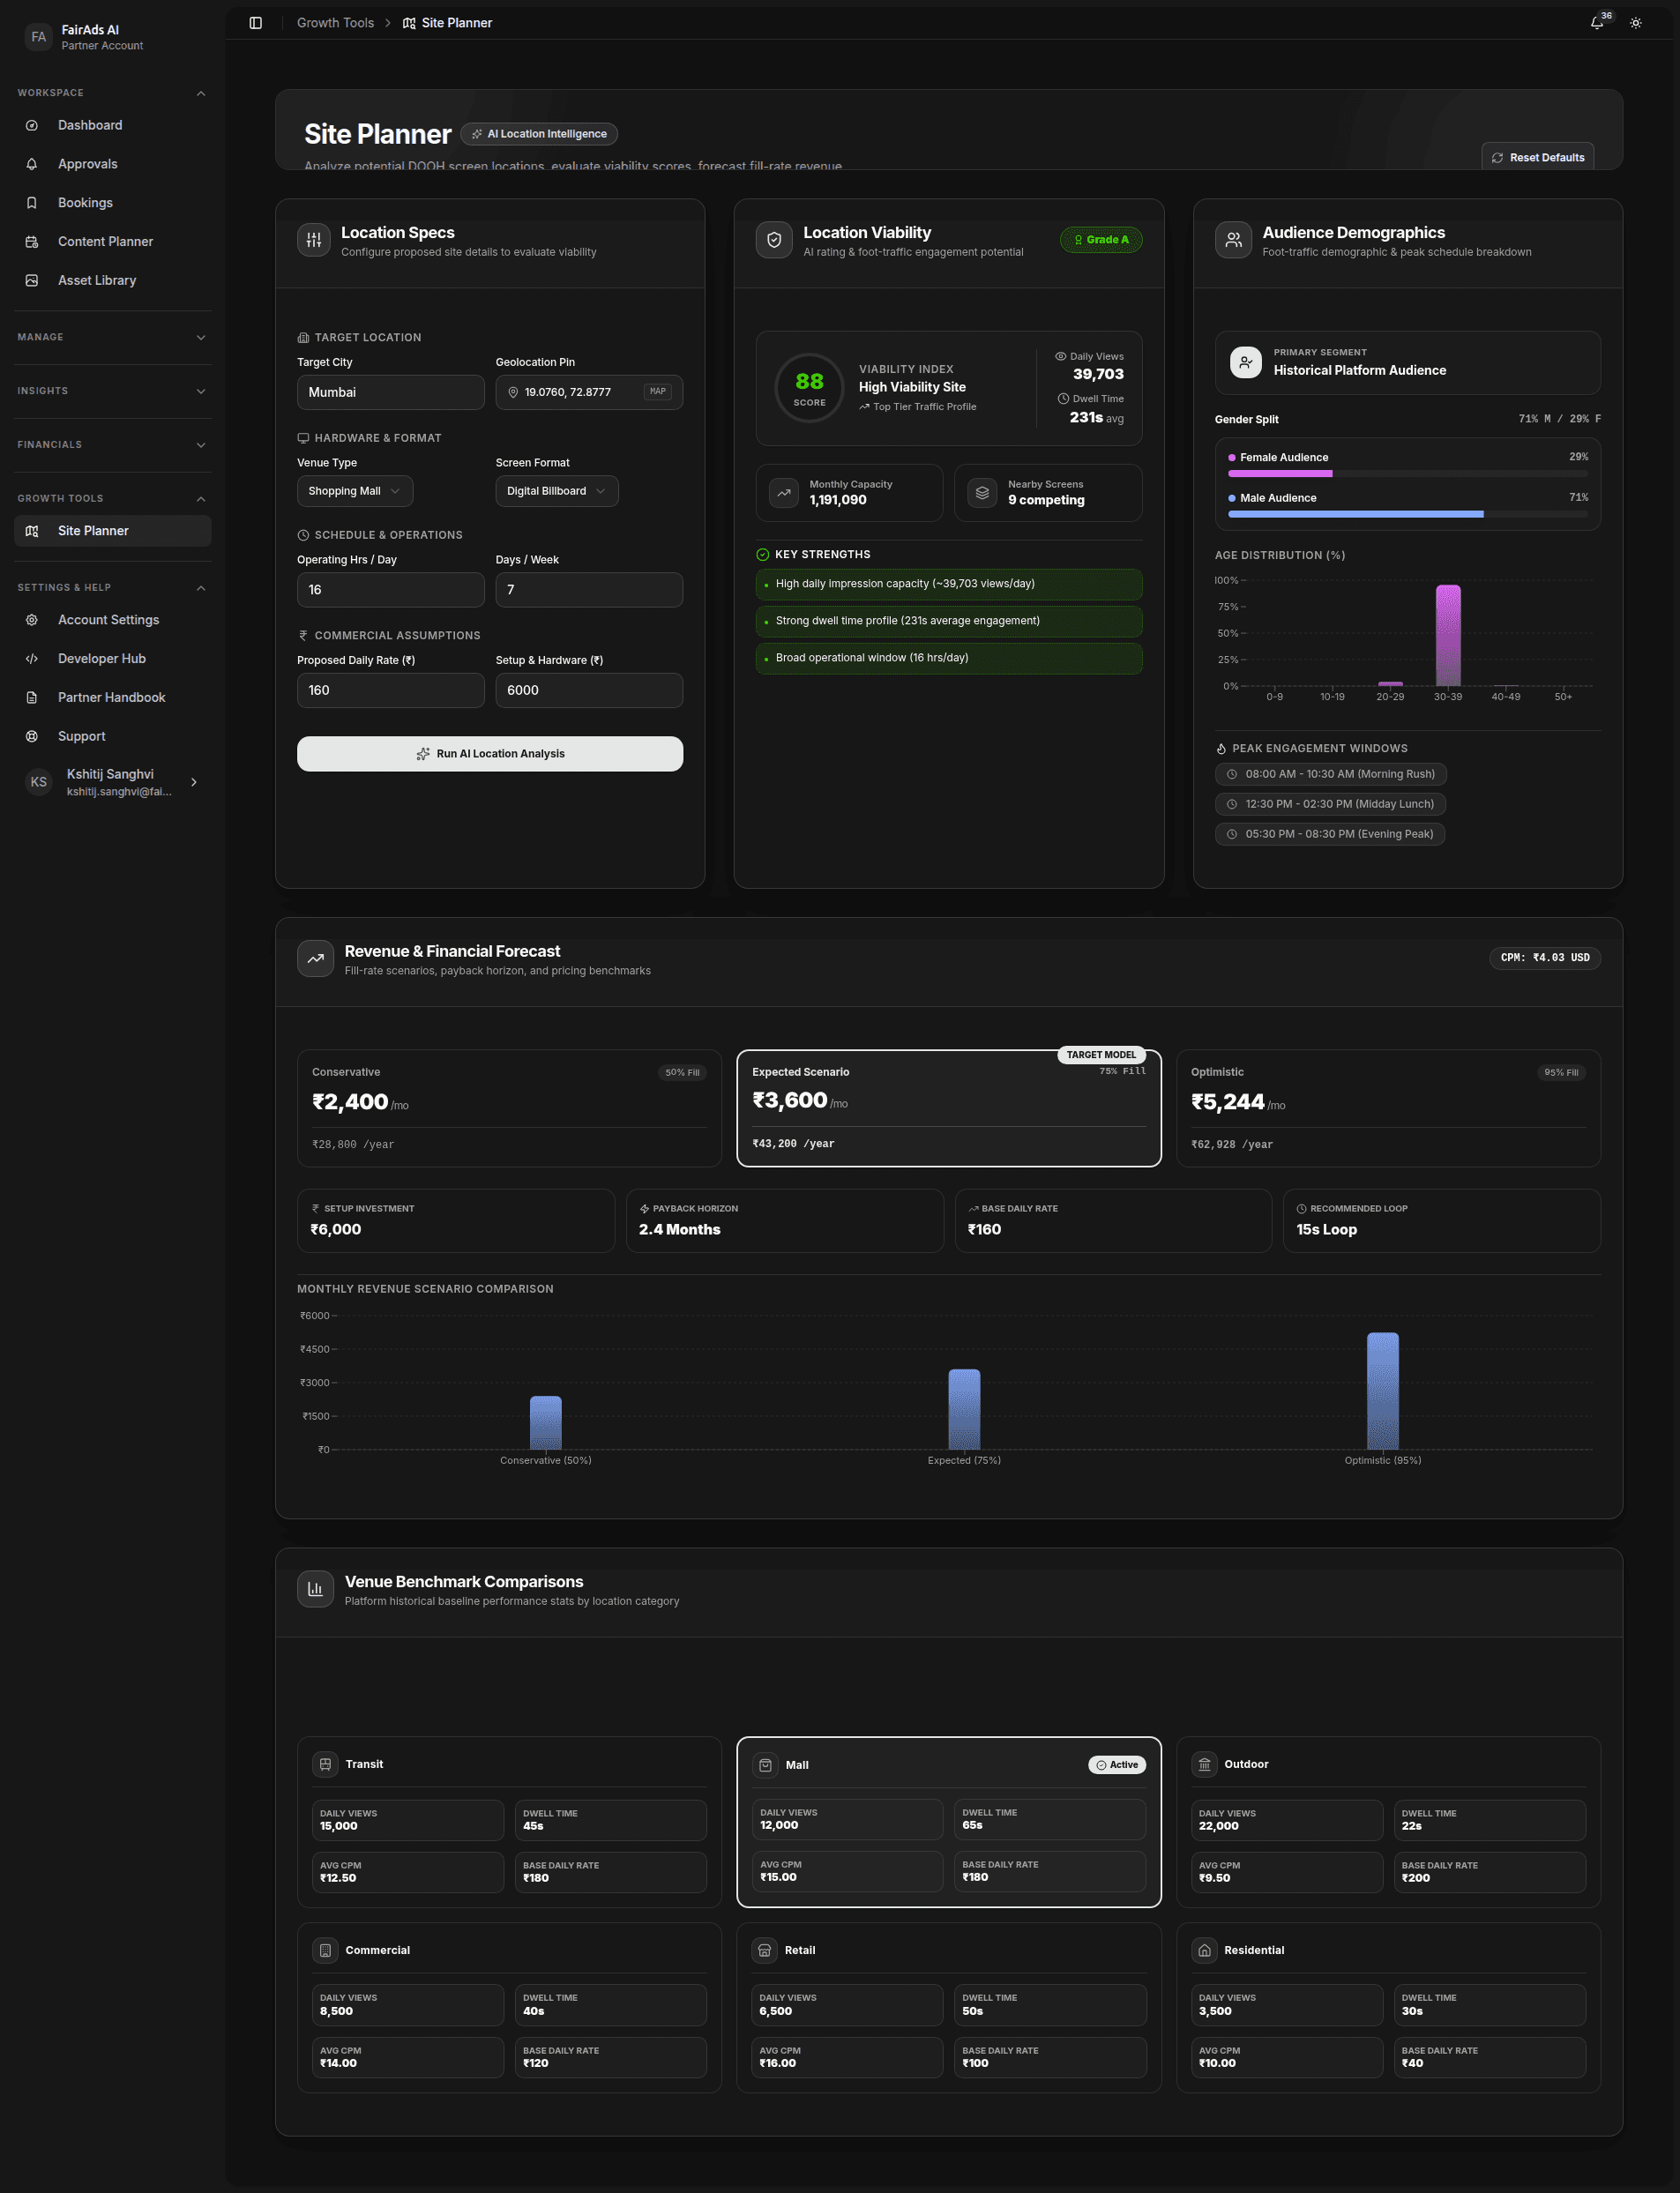
The Site Planner is an AI-assisted growth tool designed to help media owners evaluate prospective venue locations before installing hardware. Powered by AI Location Intelligence, it scores locations based on traffic density, audience demographics, and commercial viability.
🔗 Portal URL: https://partner.fairads.in/growth-tools/site-planner
Features
1. Location Specs & Viability Score
Configure your proposed site details to receive an AI-generated Viability Index score (0–100):
| Input Field | Description |
|---|---|
| Target City | City or area for the proposed screen location. |
| Geolocation Pin | Precise lat/long coordinates (auto-detected via map picker). |
| Venue Type | e.g., Shopping Mall, Transit Hub, Highway Billboard. |
| Screen Format | e.g., Digital Billboard, Kiosk, Indoor Display. |
| Operating Hrs / Day | Daily operational hours (e.g., 16 hrs). |
| Days / Week | Days per week the screen will operate. |
| Proposed Daily Rate (₹) | Your target daily revenue floor. |
| Setup & Hardware (₹) | One-time setup and hardware investment cost. |
Click Run AI Location Analysis to generate the full site evaluation report.
2. Location Viability Report
After running analysis, the AI returns:
- Viability Index Score: Grade A–F based on traffic, competition, and revenue potential.
- Daily Views Estimate: Projected daily audience impressions.
- Average Dwell Time: Estimated audience engagement duration in seconds.
- Nearby Competing Screens: Count of competing DOOH inventory within the area.
- Key Strengths: AI-identified site advantages (e.g., High impression capacity, Strong dwell profile).
3. Audience Demographics
The Audience Demographics panel provides:
- Gender Split: Male/female ratio of the target location audience.
- Age Distribution: Percentage breakdown by age group (0–8, 10–18, 20–29, 30–39, 40–49, 50+).
- Primary Segment: Dominant audience persona (e.g., Historical Platform Audience).
- Peak Engagement Windows: Morning Rush, Midday Lunch, and Evening Peak time slots.
4. Revenue & Financial Forecast
The financial projection section shows three scenario models:
| Scenario | Fill Rate | Est. Monthly Revenue |
|---|---|---|
| Conservative | ~50% | ₹2,400/mo |
| Expected (Target Model) | ~75% | ₹3,600/mo |
| Optimistic | ~95% | ₹5,244/mo |
Additional outputs include Setup Investment, Payback Horizon, Base Daily Rate, and Recommended Loop Length.
5. Venue Benchmark Comparisons
Compare your proposed location against platform-wide venue category averages:
| Venue Type | Daily Views | Dwell Time | Avg CPM | Base Daily Rate |
|---|---|---|---|---|
| Transit | 15,000 | 45s | ₹12.50 | ₹180 |
| Mall (Active) | 12,000 | 65s | ₹15.00 | ₹180 |
| Outdoor | 22,000 | 22s | ₹9.50 | ₹200 |
| Commercial | 8,500 | 60s | ₹14.00 | ₹120 |
| Retail | 6,500 | 50s | ₹18.00 | ₹100 |
| Residential | 3,500 | 30s | ₹10.00 | ₹40 |
6. Expansion Proposals
Export site analysis reports to present location proposals to venue landlords or municipal authority partners. Reports include full viability scores, demographic data, and revenue projections.
Next Steps
- Register New Screen → — Add your new location as a registered screen.
- Rate Cards → — Set pricing rules based on the AI-recommended CPM.
- Analytics → — Monitor live performance after your screen goes live.
How is this guide?